Detector Overview Powder
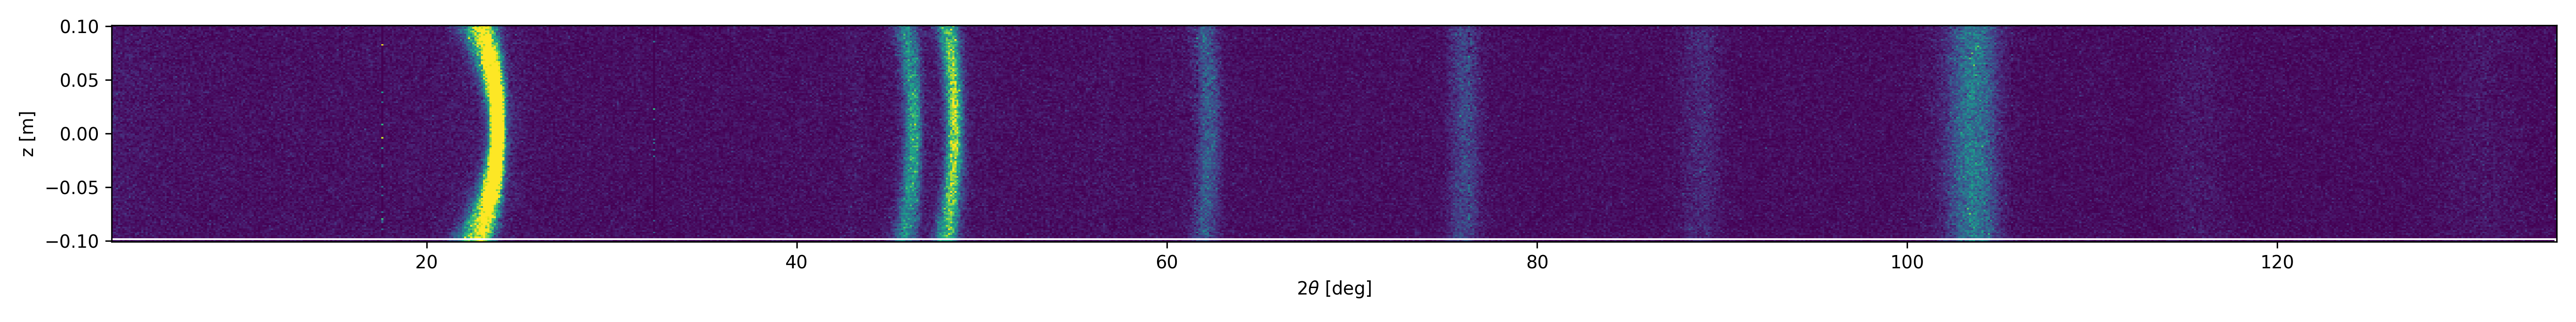
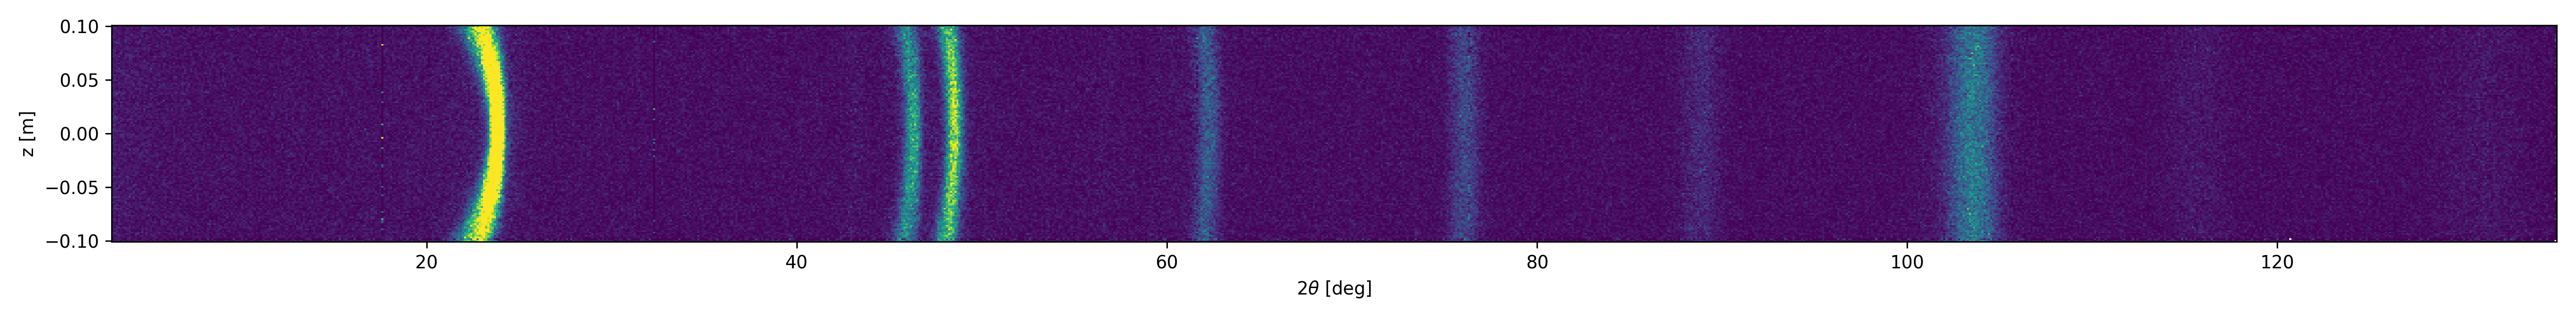
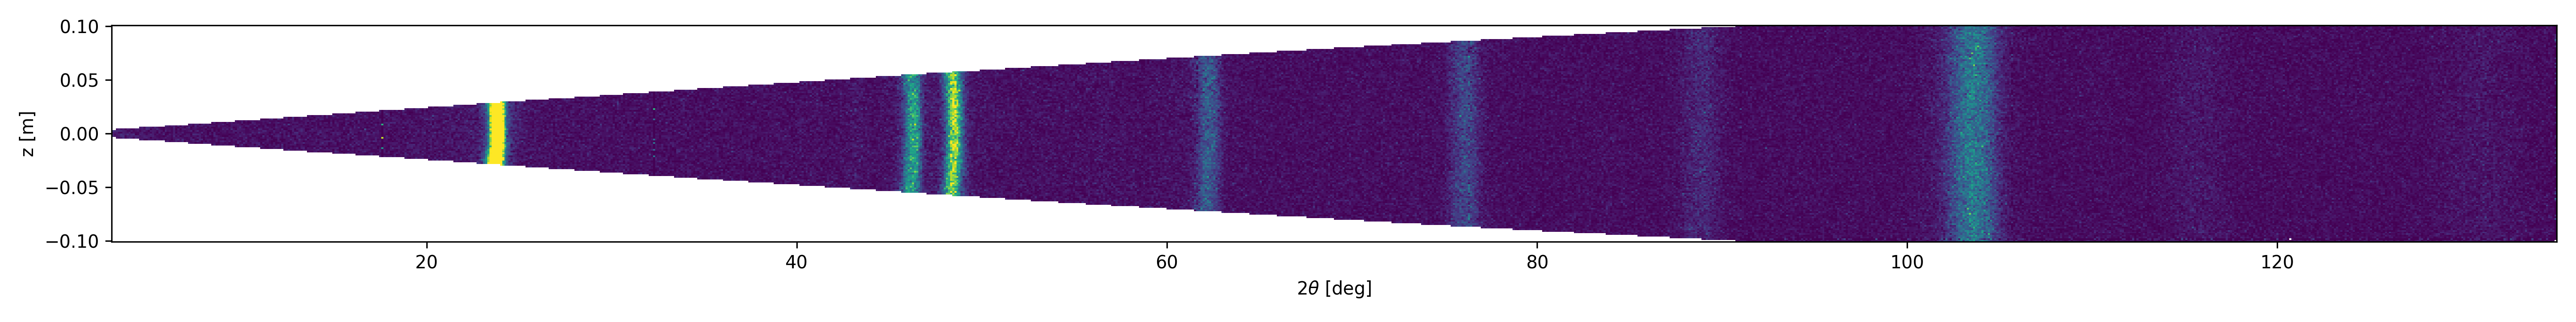
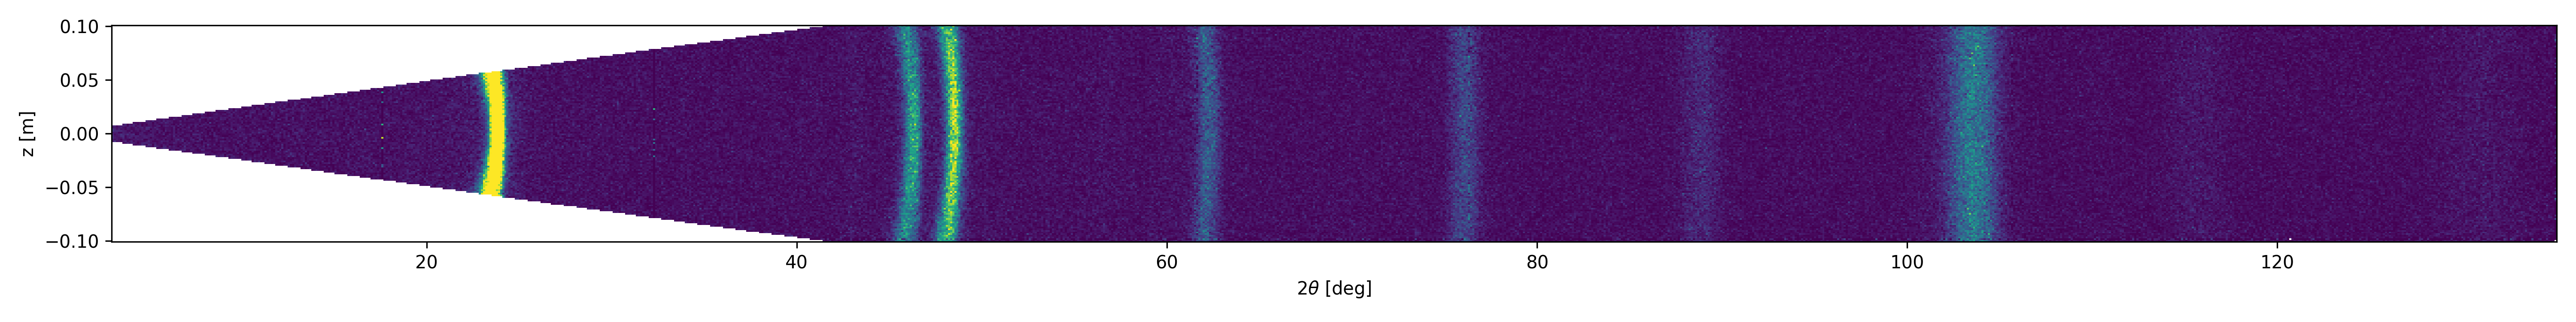
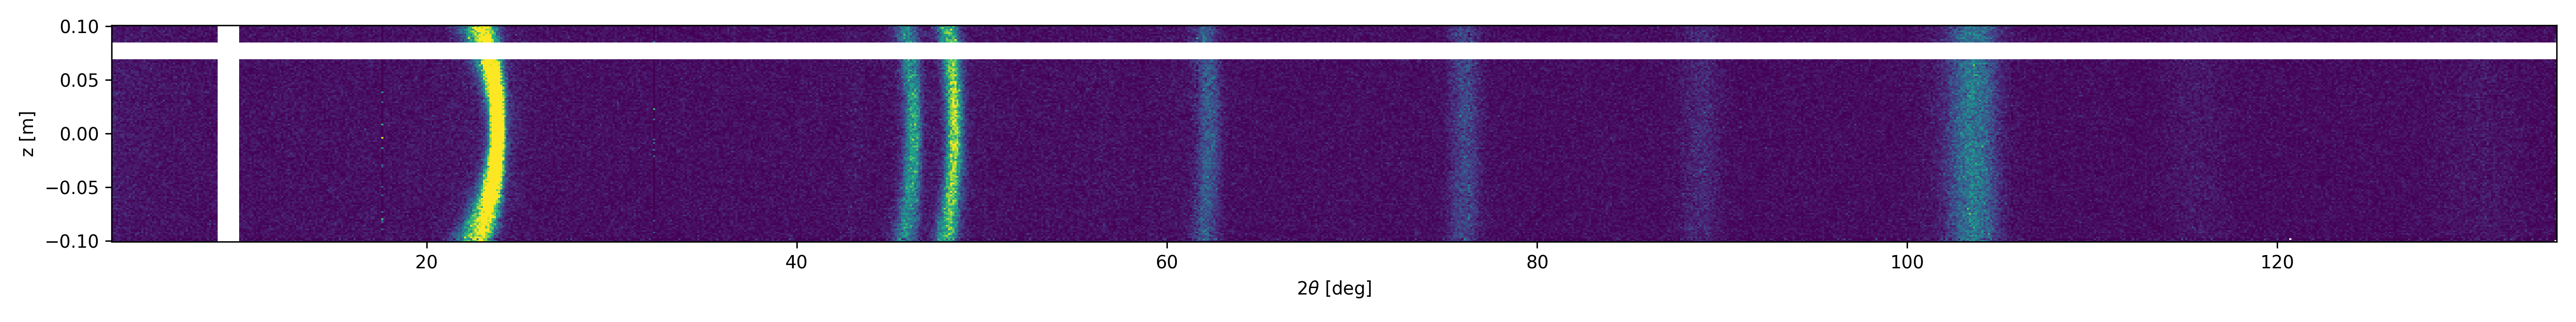
The simplets data set on the DMC instrument is that of a powder measured with only one setting. This results in a ‘one shot’ data set where scattering intensity is measured as a function of scattering angle and position out of plane. This can be visualized in the frame of reference of the instrument by the following code:
 1from DMCpy import DataFile, _tools
 2
 3# Give file number and folder the file is stored in.
 4scanNumbers = '1285'
 5folder = 'data'
 6year = 2022
 7
 8# Create complete filepath
 9file = os.path.join(os.getcwd(),_tools.fileListGenerator(scanNumbers,folder,year=year)[0])
10
11# Load data file with corrected twoTheta
12df = DataFile.loadDataFile(file)
13
14#Plot detector with defualt mask
15ax = df.plotDetector()
16cmax = 0.01
17ax._pcolormesh.set_clim(0,cmax)
18
19fig = ax.get_figure()
20fig.set_size_inches(20, 2.5)
21fig.tight_layout()
22fig.savefig('figure0.png',format='png')
23
24#Plot detector without masks
25df.generateMask(lambda x: DataFile.maskFunction(x,maxAngle=180.0),replace=True)
26
27ax2 = df.plotDetector()
28ax2._pcolormesh.set_clim(0,cmax)
29
30fig2 = ax2.get_figure()
31fig2.set_size_inches(20, 2.5)
32fig2.tight_layout()
33fig2.savefig('figure1.png',format='png')
34
35#Plot detector with 5 deg angular mask
36df.generateMask(lambda x: DataFile.maskFunction(x,maxAngle=5.0),replace=True)
37
38ax3 = df.plotDetector()
39ax3._pcolormesh.set_clim(0,cmax)
40
41fig3 = ax3.get_figure()
42fig3.set_size_inches(20, 2.5)
43fig3.tight_layout()
44fig3.savefig('figure2.png',format='png')
45
46#Plot detector with 5 deg angular mask
47df.generateMask(lambda x: DataFile.maskFunction(x,maxAngle=10.0),replace=True)
48
49ax4 = df.plotDetector()
50ax4._pcolormesh.set_clim(0,cmax)
51
52fig4 = ax4.get_figure()
53fig4.set_size_inches(20, 2.5)
54fig4.tight_layout()
55fig4.savefig('figure3.png',format='png')
56
57#Plot detector with line mask
58df.generateMask(lambda x: DataFile.maskFunction(x,maxAngle=180.0),replace=True)
59
60df.mask[0,10:20,:] = True
61df.mask[0,:,50:60] = True
62
63ax5 = df.plotDetector()
64ax5._pcolormesh.set_clim(0,cmax)
65
66fig5 = ax5.get_figure()
67fig5.set_size_inches(20, 2.5)
68fig5.tight_layout()
69fig5.savefig('figure4.png',format='png')
- The software use the defualt normalization from the calibration file which is matched with the file number. As default a mask for the top horizontal and the last vertical lines of the detector is used as these have an issue. The code show how the mask can be removed, how an angular mask can be added, and how a line mask cna be added. Running the above code generates the following images showing neutron intensity as function of 2Theta and out of plane position: Note that two theta is negative, which is defualt at DMC.