Box integration
This tutorial demonstrate a primitive method for integrating Bragg peaks from single crystals. Here, we define a range in A3 and 2Theta, and sum the intensities in the region. This means that the detector operates as a point detector. We can plot the integrated intensities and fit it with a Gaussian peak. You shoud use InteractiveViewer and View3D to determin the correct integration parameters, in addition to inspecting the roi. Note that when you use several dataFiles in one dataSet, you must give the dataFile index in the peakDict.
  1from DMCpy import DataSet,DataFile,_tools
  2import numpy as np
  3import pickle
  4
  5
  6# name for exports
  7planeFigName = r'sample'
  8
  9# Give file number and folder the file is stored in.
 10scanNumbers = '8540'
 11folder = r'data\SC'
 12year = 2022
 13
 14filePath = _tools.fileListGenerator(scanNumbers,folder,year=year)
 15
 16# # # load dataFiles
 17dataFiles = [DataFile.loadDataFile(dFP) for dFP in filePath]
 18
 19# load data files and make data set
 20ds = DataSet.DataSet(dataFiles)
 21
 22# use InteractiveViewer to find conditions for integration
 23if False:
 24   IA1 = ds[0].InteractiveViewer()
 25   IA1.set_clim(0,20)
 26   IA1.set_clim_zIntegrated(0,1000)
 27
 28
 29peakDict = { }
 30
 31# stor integration parameters in peakDict
 32peakDict['111'] = {
 33              'h' : 1,
 34              'k' : 1,
 35              'l' : 1,
 36              'df' : 0,
 37              'A3_center' : 113.57,
 38              'A3_minus' : 10,
 39              'A3_pluss' : 10,
 40              'tth' : 49.5,
 41              'tth_minus' : 2.1,
 42              'tth_pluss' : 2.5,
 43              'startZ' : 35,
 44              'stopZ' : 100,
 45              'vmin' : 0,
 46              'vmax' : 0.005,
 47          }
 48
 49# add more peaks to the peakDict
 50peakDict['110'] = {
 51              'h' : 1,
 52              'k' : 1,
 53              'l' : 0,
 54              'df' : 0,
 55              'A3_center' : 78.5,
 56              'A3_minus' : 10,
 57              'A3_pluss' : 10,
 58              'tth' : 36.2,
 59              'tth_minus' : 2.1,
 60              'tth_pluss' : 2.5,
 61              'startZ' : 35,
 62              'stopZ' : 85,
 63              'vmin' : 0,
 64              'vmax' : 0.005,
 65          }
 66
 67# to integrate all peaks in peakDict
 68integrationList = None
 69
 70# to integrate only one or a list of peak, list the peaks you want to integrate in integrationList
 71integrationList = ['111']
 72
 73# keywords for box integration
 74integrationKwargs = {
 75'roi' : True,
 76'saveFig' : r'docs/Tutorials/box/box1_',
 77'title' : r'Integated data',
 78'integrationList' : integrationList,
 79'closeFigures' : True,
 80'plane' : 'HHL'
 81}
 82
 83integratedPeakDict = ds.boxIntegration(peakDict,**integrationKwargs)
 84
 85# print information
 86if False:
 87   for peak in integratedPeakDict:
 88      print(integratedPeakDict[peak]['fit'][1])
 89
 90
 91# Make hkl file
 92if False:
 93   # Specify the file name
 94   file_name = f"docs/Tutorials/box/{planeFigName}.hkl"
 95
 96   # Open the file in write mode
 97   with open(file_name, 'w') as file:
 98      # Write the column headers with appropriate spacing
 99      file.write('{:>3} {:>3} {:>3} {:>10} {:>10}\n'.format('h', 'k', 'l', 'Int', 'err'))
100
101      # Loop through the peaks in integratedPeakDict and write the data
102      for peak in integratedPeakDict:
103          # Format the data with consistent spacing, considering the negative sign
104          h = int(integratedPeakDict[peak]['h'])
105          k = int(integratedPeakDict[peak]['k'])
106          l = int(integratedPeakDict[peak]['l'])
107          intensity = np.round(integratedPeakDict[peak]['summed_counts'], 4)
108          error = np.round(np.sqrt(integratedPeakDict[peak]['summed_counts'] * np.mean(integratedPeakDict[peak]['monitors'])) / np.mean(integratedPeakDict[peak]['monitors']), 4)
109
110          # Use a modified format string to align numbers to the right
111          peak_data = '{:>3} {:>3} {:>3} {:>10} {:>10}\n'.format(h, k, l, intensity, error)
112
113          # Write the formatted data to the file
114          file.write(peak_data)
115
116   print(f"Data has been written to {file_name}")
117
118
119# save dictionary
120if False:
121   file_name = f"docs/Tutorials/box/{planeFigName}.pickle"
122   with open(file_name, 'wb') as file:
123      pickle.dump(integratedPeakDict, file)
124   print(f"Data has been written to {file_name}")
125
126   # load dictionary
127   if False:
128      # Load dictionary from file
129      file_name = f"docs/Tutorials/box/{planeFigName}.pickle"
130      with open(file_name, 'rb') as file:
131          loaded_dict = pickle.load(file)
132
133      print(loaded_dict)
134
135
136# export xy data
137if False:
138   file_name = f"docs/Tutorials/box/{planeFigName}.txt"
139   with open(file_name, 'w') as file:
140      for key, values in integratedPeakDict.items():
141          # print(key)
142          file.write(f'{key}' + '\n')
143          file.write(' '.join(map(str, values['peak_cut'][0])) + '\n')
144          file.write(' '.join(map(str, values['peak_cut'][1])) + '\n')
145          file.write(' '.join(map(str, values['monitors'])) + '\n')
146          file.write('\n')  # Add a new line to separate data sets
147
148   print(f"Data has been written to {file_name}")
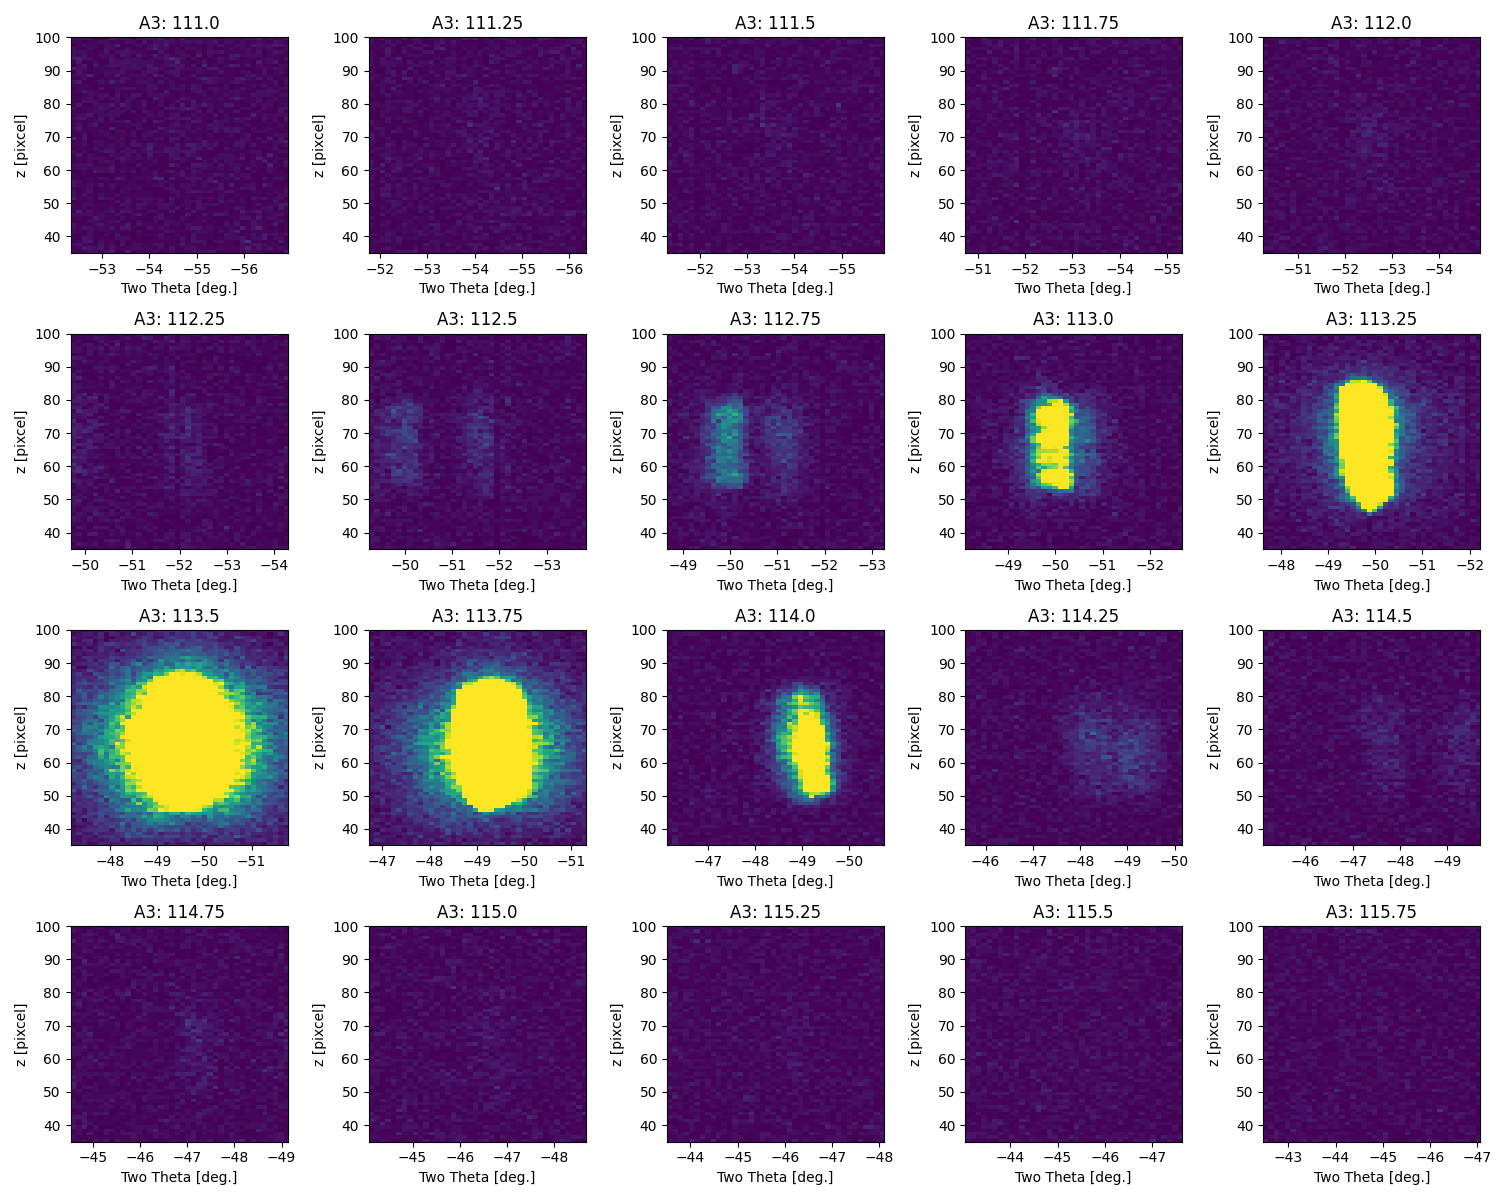
The above code takes the data from the A3 scan file dmc2022n008540, and select and area in A3 and pixels. It then sums the detector in the given pixel area and extract the intensity as a function of A3. The integration details are given in a dictionary. The A3 range is given in frames, while the tth range is in degrees. startZ and stopZ gives the height on the detector in pixels (0-128). The roi keyword determines if the rois are plotted.
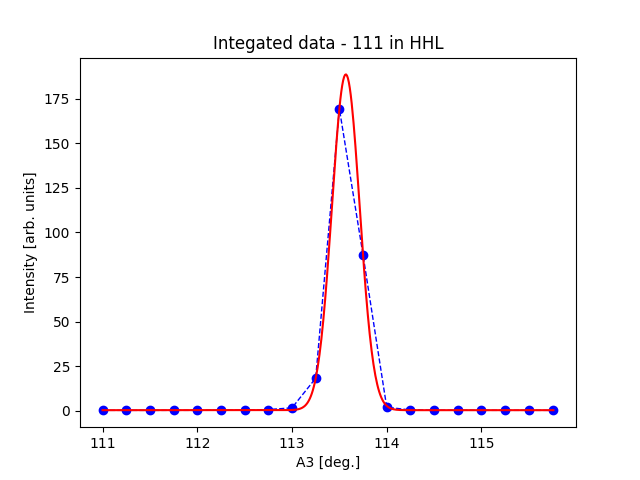
Intensity as a function of A3
Visualization of the pixel area of the detector used